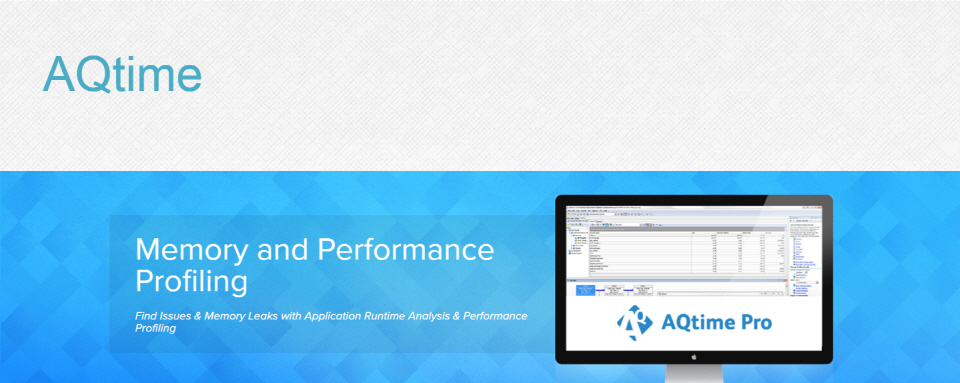
DevOps teams deploying .Net webservers can use AQtime's performance profilers to isolate performance issues and bottlenecks. Diving deeper with AQtime's tools ensures that problems are pinpointed quickly, so that environments are running at peak performance.

AQtime offers multiple modes for application performance analysis. You can start with a quick performance inspection using the lightweight Sampling profiler and then drill deeper into the hot spots using the more accurate Performance profiler.
- Profile what you need
- Insightful performance reports
- Thread-Aware measurements
- Comparable profiling data
AQtime Memory Monitor shows your application’s memory and resource allocations in real time to help you detect excessive memory and resource usage. At any time, you can capture a complete memory snapshot for more comprehensive application memory analysis.
- Monitor memory leaks
- Compare memory snapshots
- Monitor memory allocation in real time


AQtime’s code coverage analysis shows you which source files, functions and lines of code have been covered by tests, are untested or only partially tested. This helps you know what additional tests to create and how to improve your existing tests.
- Find unused or untested code
- Selective coverage
- Convenient analysis of coverage data
- Merge coverage data
AQtime includes a Failure Emulator that lets you simulate faults during your application run and monitor their impact on the application behavior. The Failure Emulator does not need to make any changes in your application code. You can inject faults into applications with no source code available.
- Simulate various fault types
- Integrated debugging aids
- No source code changes


| Node-Lock Lincense | Floating License | |
| 라이선스가 설치된 PC에서만 제품을 사용 가능 | 다수의 PC에 제품 설치가 가능하나 구매된 라이선스 수량만큼만 동시 실행 가능 | |
| * 가상머신에 사용 시에는 Floating License가 필요합니다. | ||
Email : sales@raynjay.com / 전화 : 070-8151-7749
